
Understand a hiking trail map, printed or digital


A very basic guide that explains with pictures how a hiking map works. It is aimed at those who want to get to know nature using specialist hiking maps.
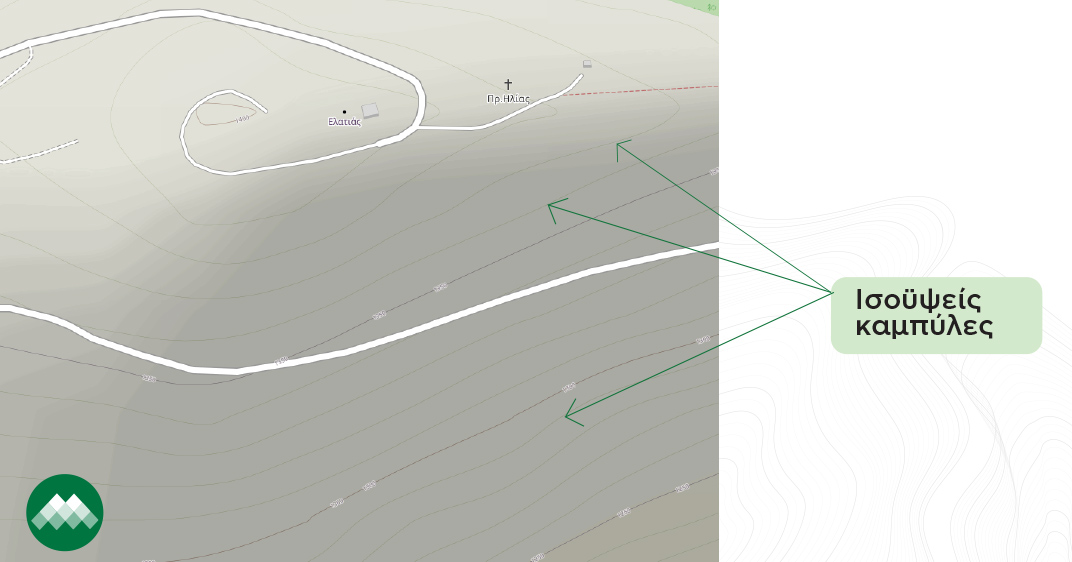
Level curves
On a map, isopotential curves are lines connecting points with the same altitude or depth. This means that all points on an isohyphenated curve have the same elevation or depth.
On the map, contour lines are usually shown as continuous curved lines connecting points with the same value of altitude or depth.
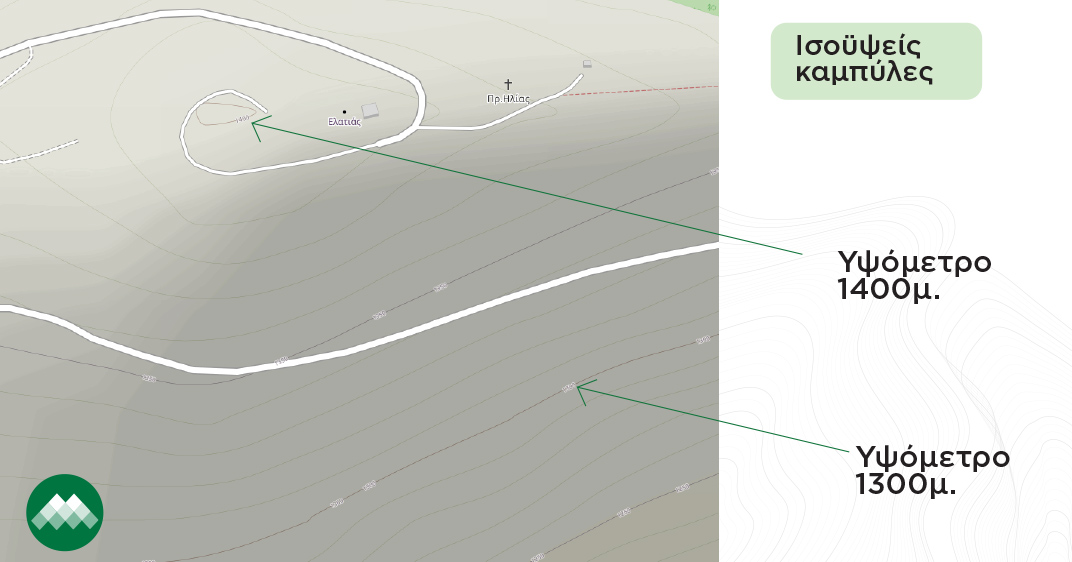
In addition, they show the height of a place, based on sea level
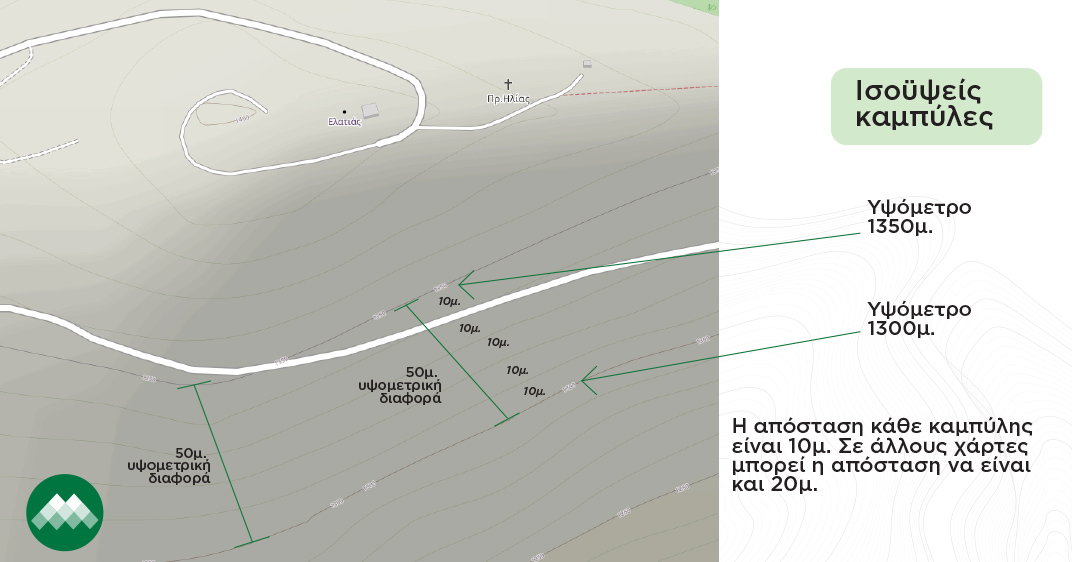
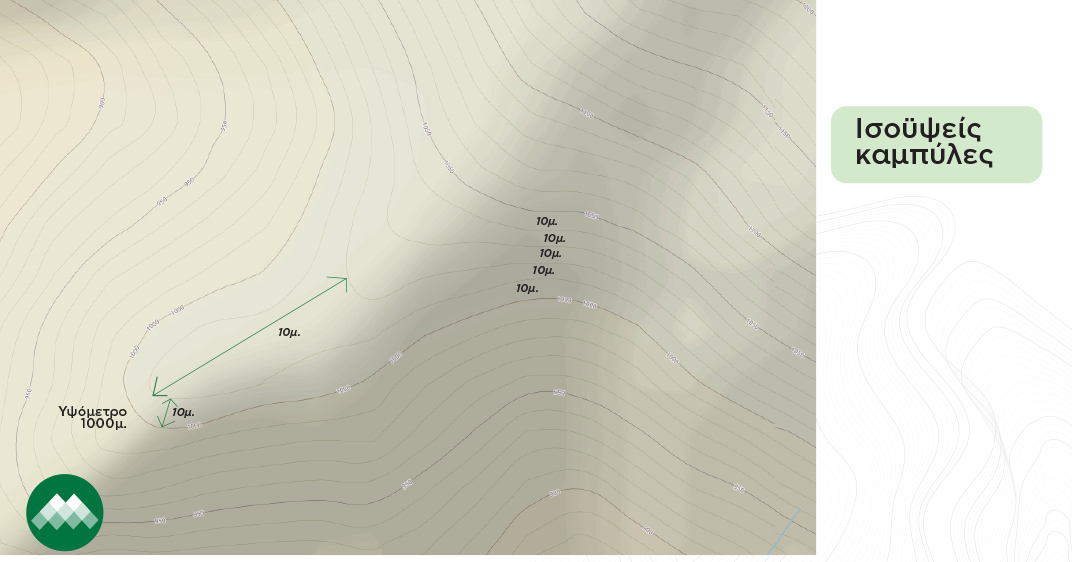
The distance of each curve on most mountain maps is 10m or 20m.
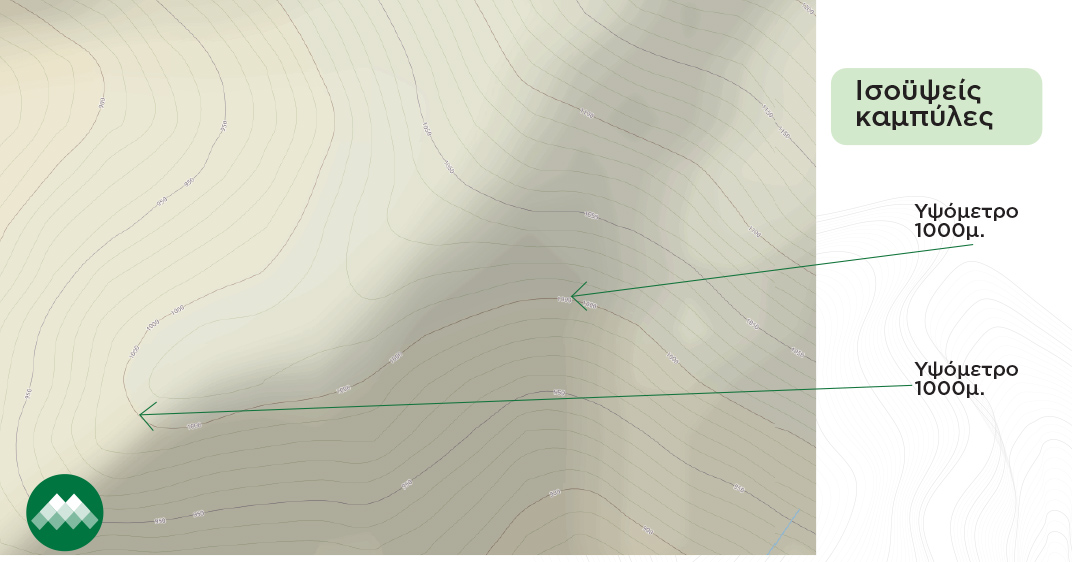
The level curves on the map can show the topography of the area, i.e. the morphology of the terrain, and can be used to understand the geography of the area and navigate in space. For example, in the image above we have an altitude of 1000m top right and the same altitude bottom left and at any point on the same isohypsometric curve with reference 1000m.
In the exact top curve the altitude at all points will be 1010 m (since the distance between the isopotential curves is 10 m).
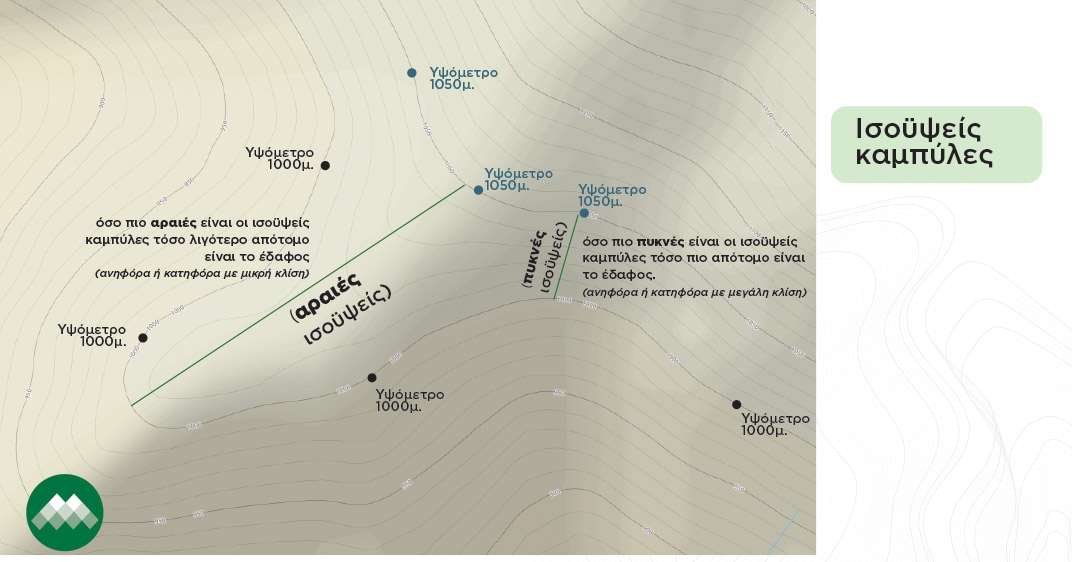
The thinner the isosceles curves are between them, the less steep the terrain. Conversely, the more dense (close to each other) the isomorphic curves are, the steeper the terrain (uphill or downhill with a steep slope).
Technical characteristics
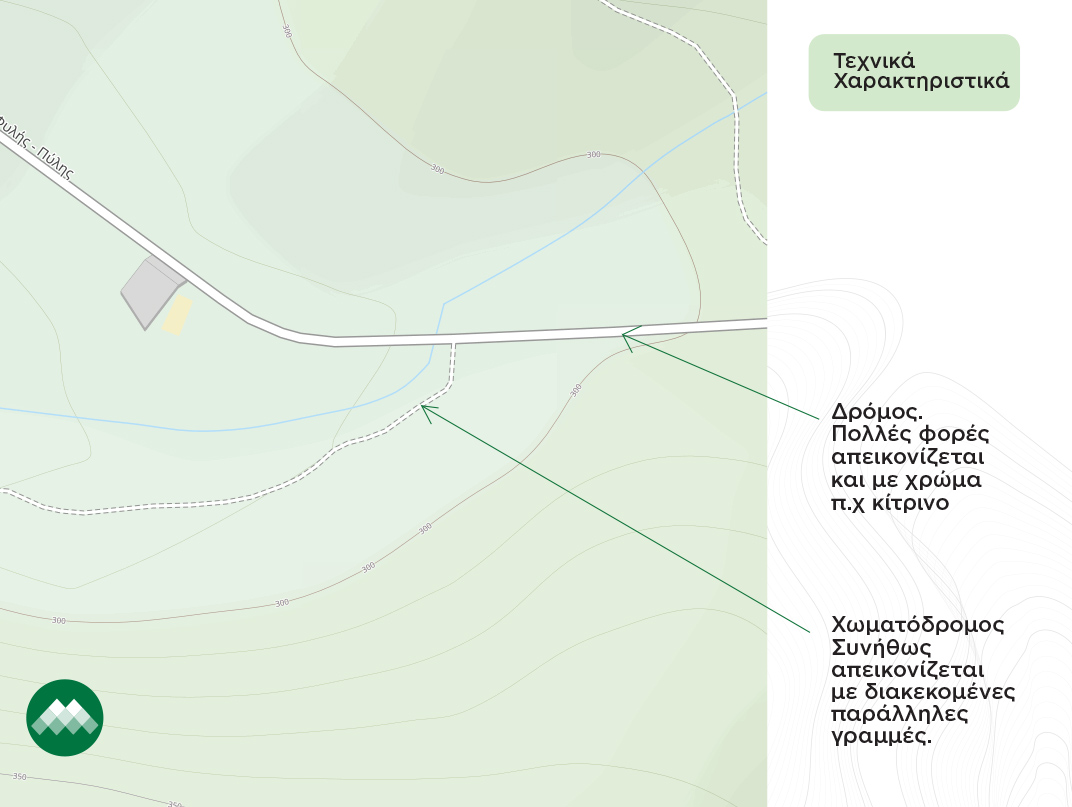
The hiking trail is marked on the map in different ways. With dotted lines, or with different colours and a specific line thickness to distinguish it from forest roads or main roads. The map legend usually shows how a trail is mapped.
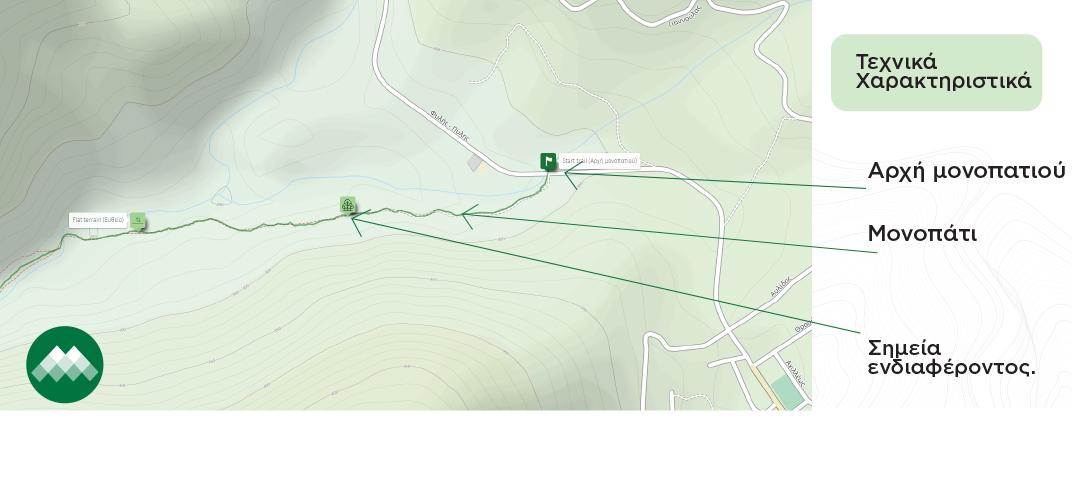
Mountain maps (digital or printed) show the various features of the environment, such as rivers, lakes, forests, and waterfalls, using icons. This is useful for navigation and area identification.
The information on the map (digital or printed) is arranged in such a way that when viewed it faces north.
Mileage distances on a path
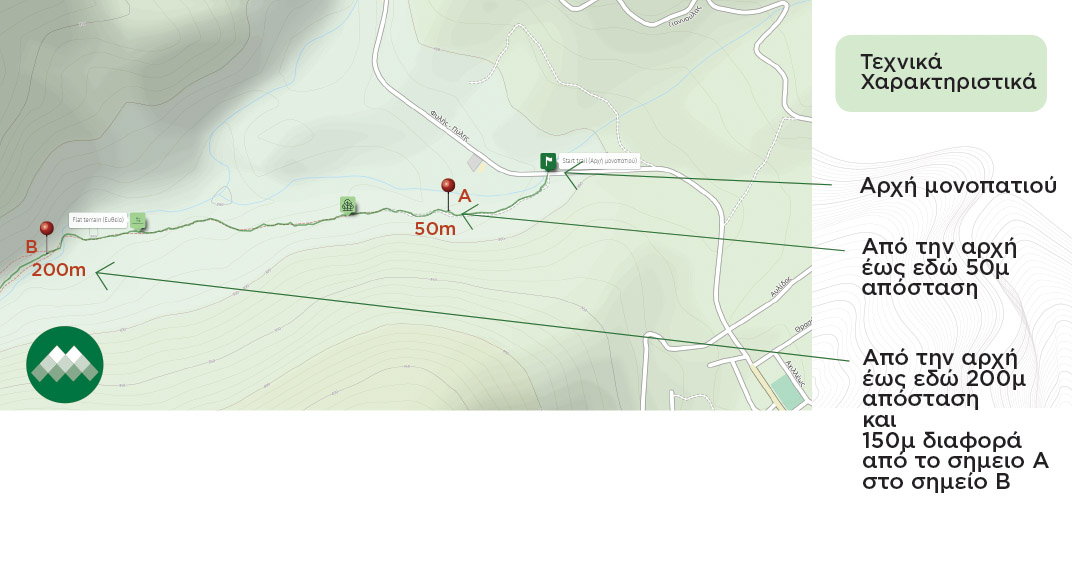
On most (usually printed hiking maps) it is shown with a "pin" how many kilometres or metres the point is from the trailhead. The first 'pin' shows the kilometres or metres from the start of the hiking route to the point. The second "pin" shows the kilometres or metres from the start of the route to this point, etc.
Map scale
In a map, scale refers to the relationship between actual distances in the world and the corresponding distances on the map. This means that scale determines how small or large an element on the map will be in relation to its actual size in the world.
Scale is usually expressed as a ratio, e.g. 1:10,000, and this means that 1 unit on the map corresponds to 10,000 units in the real world. In other words, an object that is 2 cm long in the real world will be 0.0002 cm long on the map if the scale is 1:10,000.
Scale is important to the map user as it helps them understand how big or small an area is, how far different points are from each other, and how big or small the items on the map are.
Important observations
A route on a map with an aerial photo background and not the above features is just a route without necessarily meaning that the hiker can identify what is on the route they will be traversing (especially a hiker who has no experience of mountain trails)! Let's keep in mind that an aerial photo (i.e. without the above very basic features) seeing it crossing a trail through vegetation does not necessarily make it crossing a forest.. but it can also cross a place with very low vegetation!
Despite the impressive capabilities of technology, don't underestimate a printed map! They usually have very useful features that will help you get a full picture of a place if you decide to stay there for several days...